
A golden parameter dashboard: did every automatic network change keep the cells healthy?
A national mobile operator in Indonesia lets software tune its network on its own: changing power, mobility, capacity and other settings on thousands of cells every day. That only works if someone can check the result. I built the dashboard that answers two questions for every change: did the job run, and did the cell keep performing afterwards.
National mobile operator (Indonesia)
Full stack engineer, built the dashboard end to end
1 month
React, TypeScript, Mapbox, ECharts, MUI Data Grid, Redux, Ant Design
The problem
Modern mobile networks are partly self driving. Automation jobs adjust cell settings by themselves: switch capacity off at night to save energy, rebalance load between cells, fix neighbour lists, wake up a sleeping cell. On a national network that adds up to a huge number of jobs every week, across 2G, 4G and 5G.
Automation without visibility is a risk. A change can fail to apply, or apply fine and quietly hurt the cell: less traffic, worse throughput, unhappy customers. The engineering team needed one place to see every job and its effect, and to find the few bad changes among the thousands of good ones.
What the dashboard answers
-
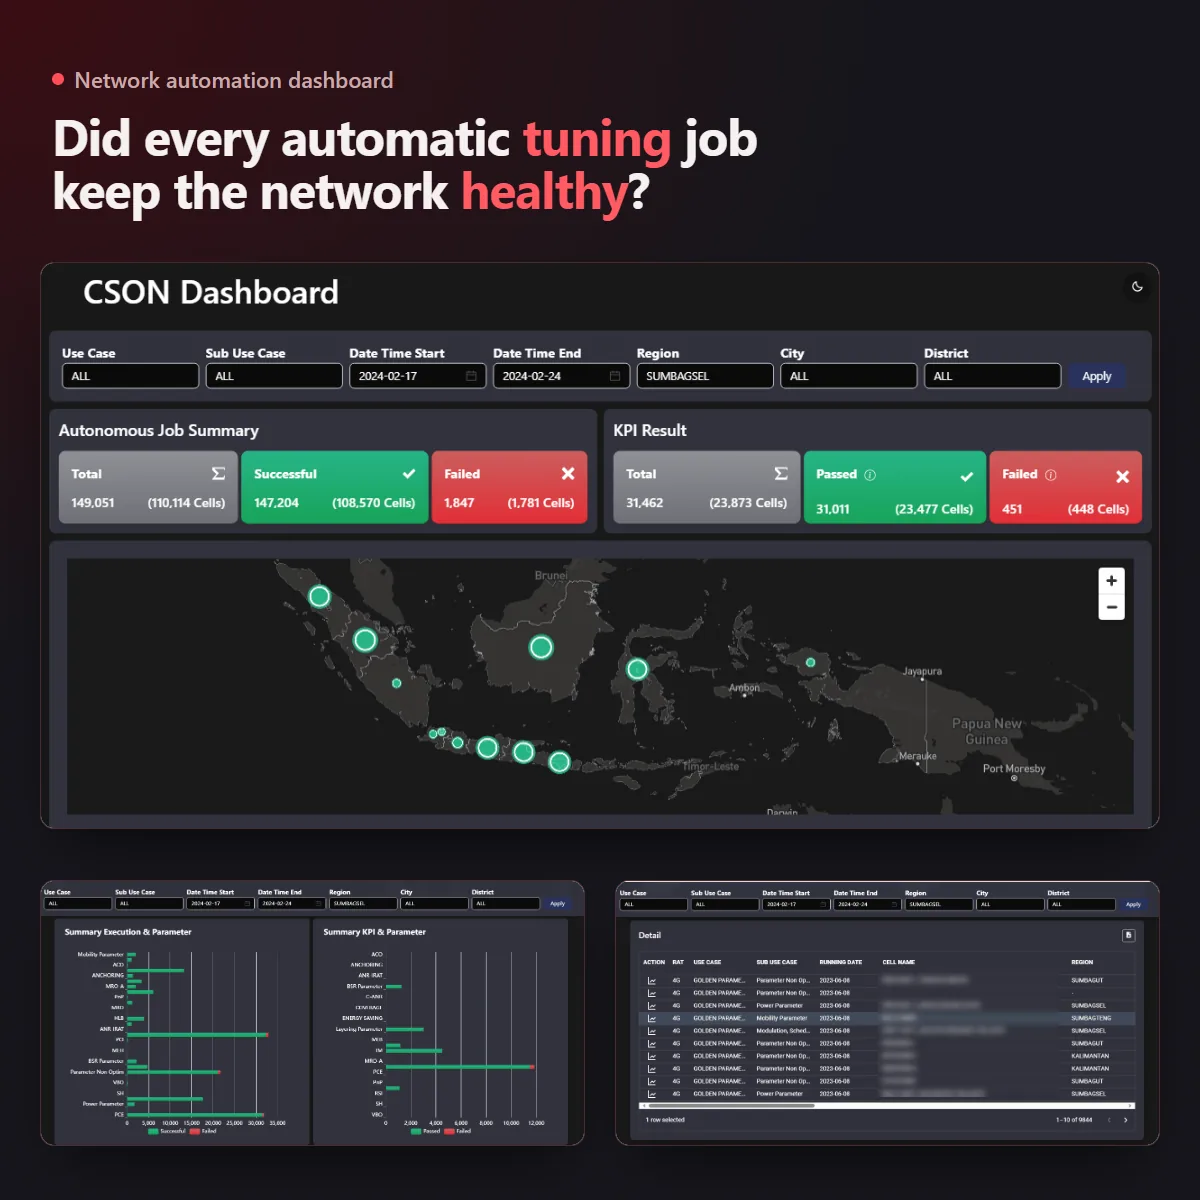
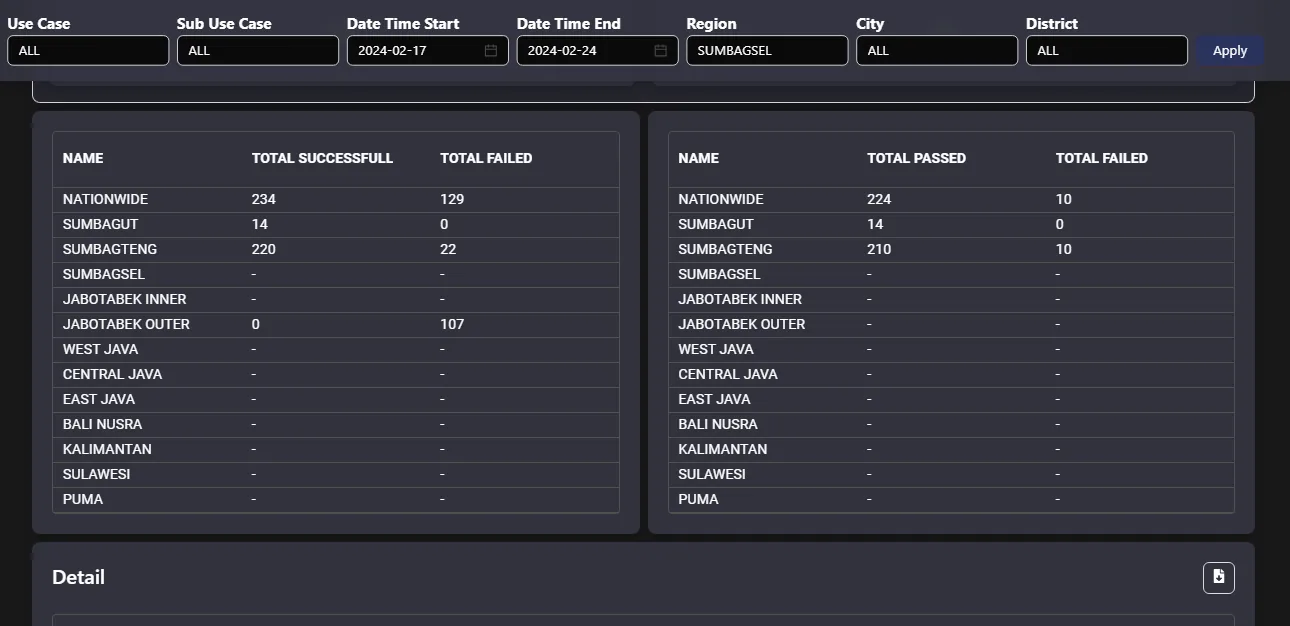
"Did the jobs run?" The job summary shows total, successful and failed executions, and how many cells each one touched. Next to it, the KPI result shows how many changes passed or failed the health check afterwards. An info tooltip spells out the rule: a change fails when the cell's traffic drops by more than half, compared both with the day of the change and with the week before.
-
"Where is it happening?" A map of Indonesia with a pulsing dot per area, sized by how many jobs ran there. Hover for the breakdown by use case, filter down to a region, city or district.
-
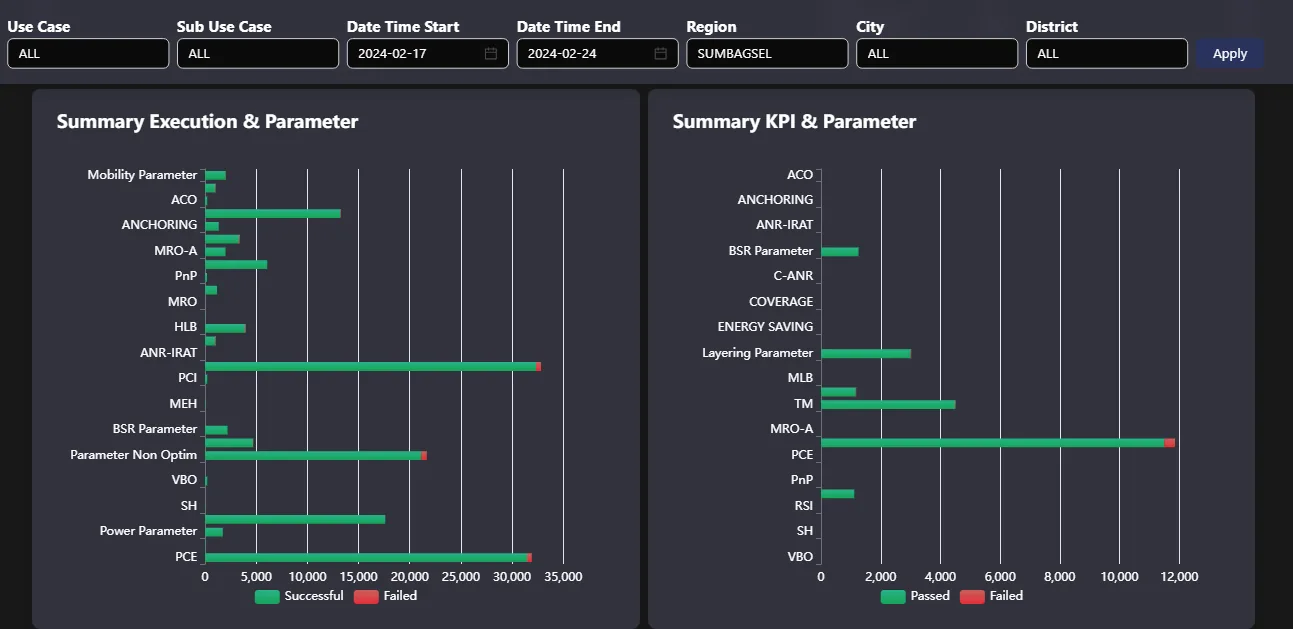
"Which kind of change goes wrong?" Two charts break success and failure down by parameter group: power, mobility, layering, modulation and more. Two trend charts show the same over time, so a sudden spike of failures on one day stands out right away.
-
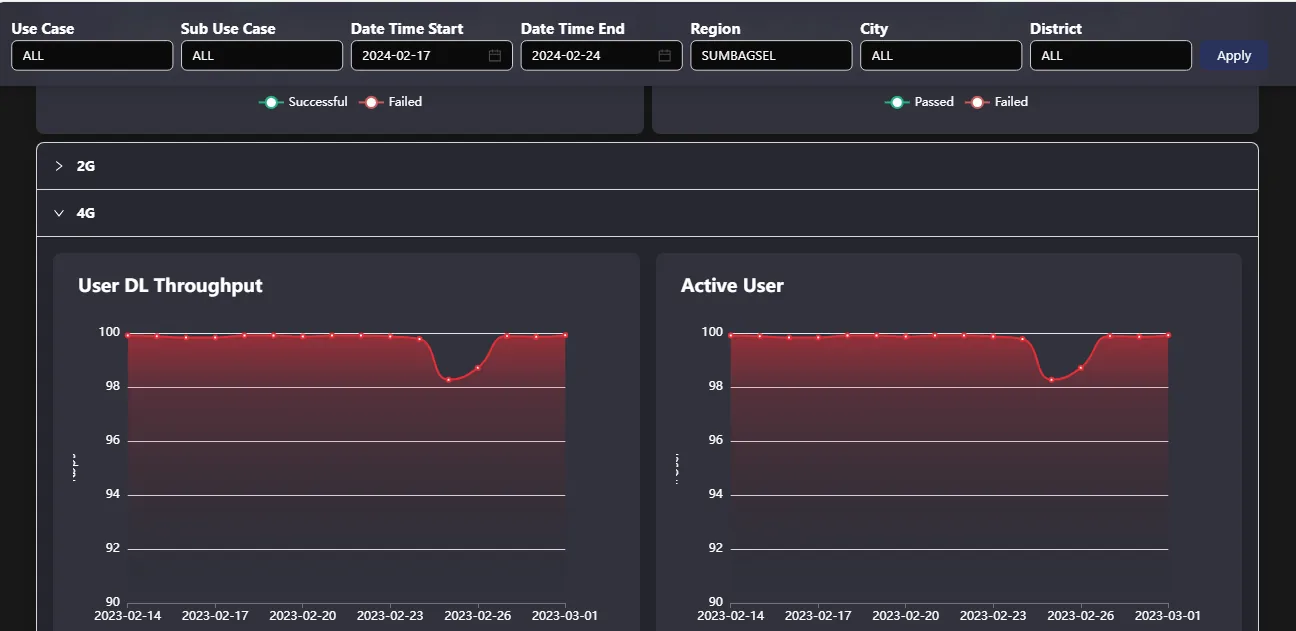
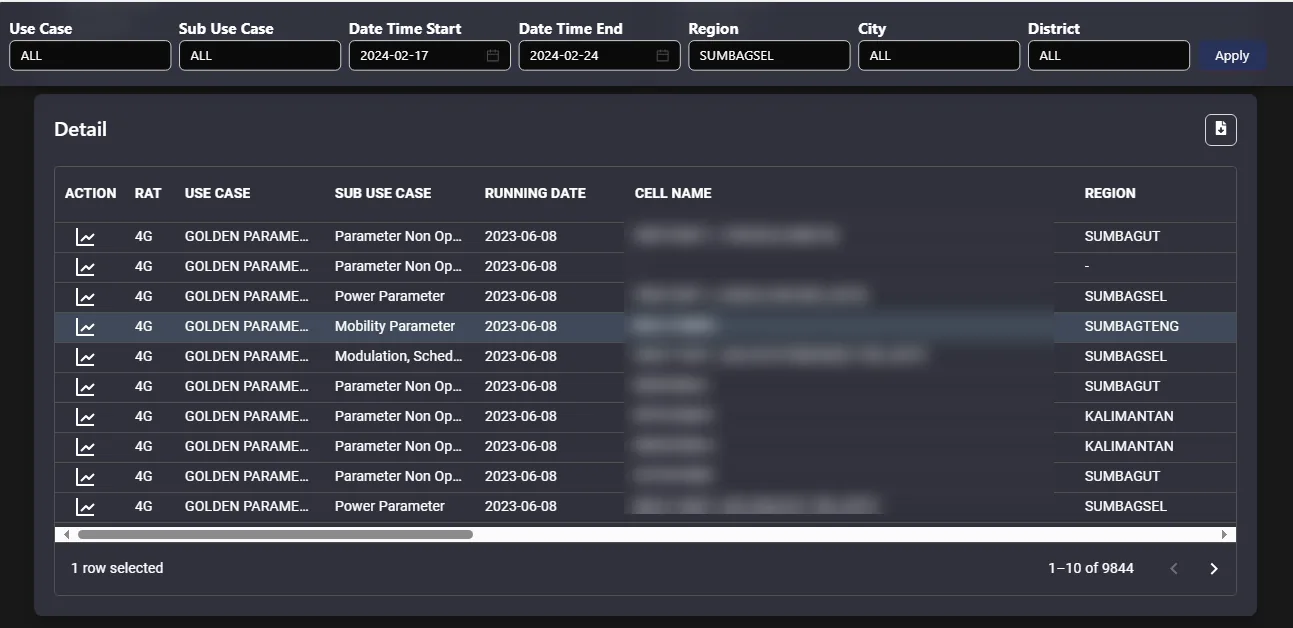
"What happened to that cell?" KPI trends like throughput, active users, call setup success and handover success, grouped by 2G, 4G and 5G. The detail table lists every change on every cell with its use case and date; one click on a row opens that cell's KPI charts, and the whole filtered list downloads as a CSV.
The architecture
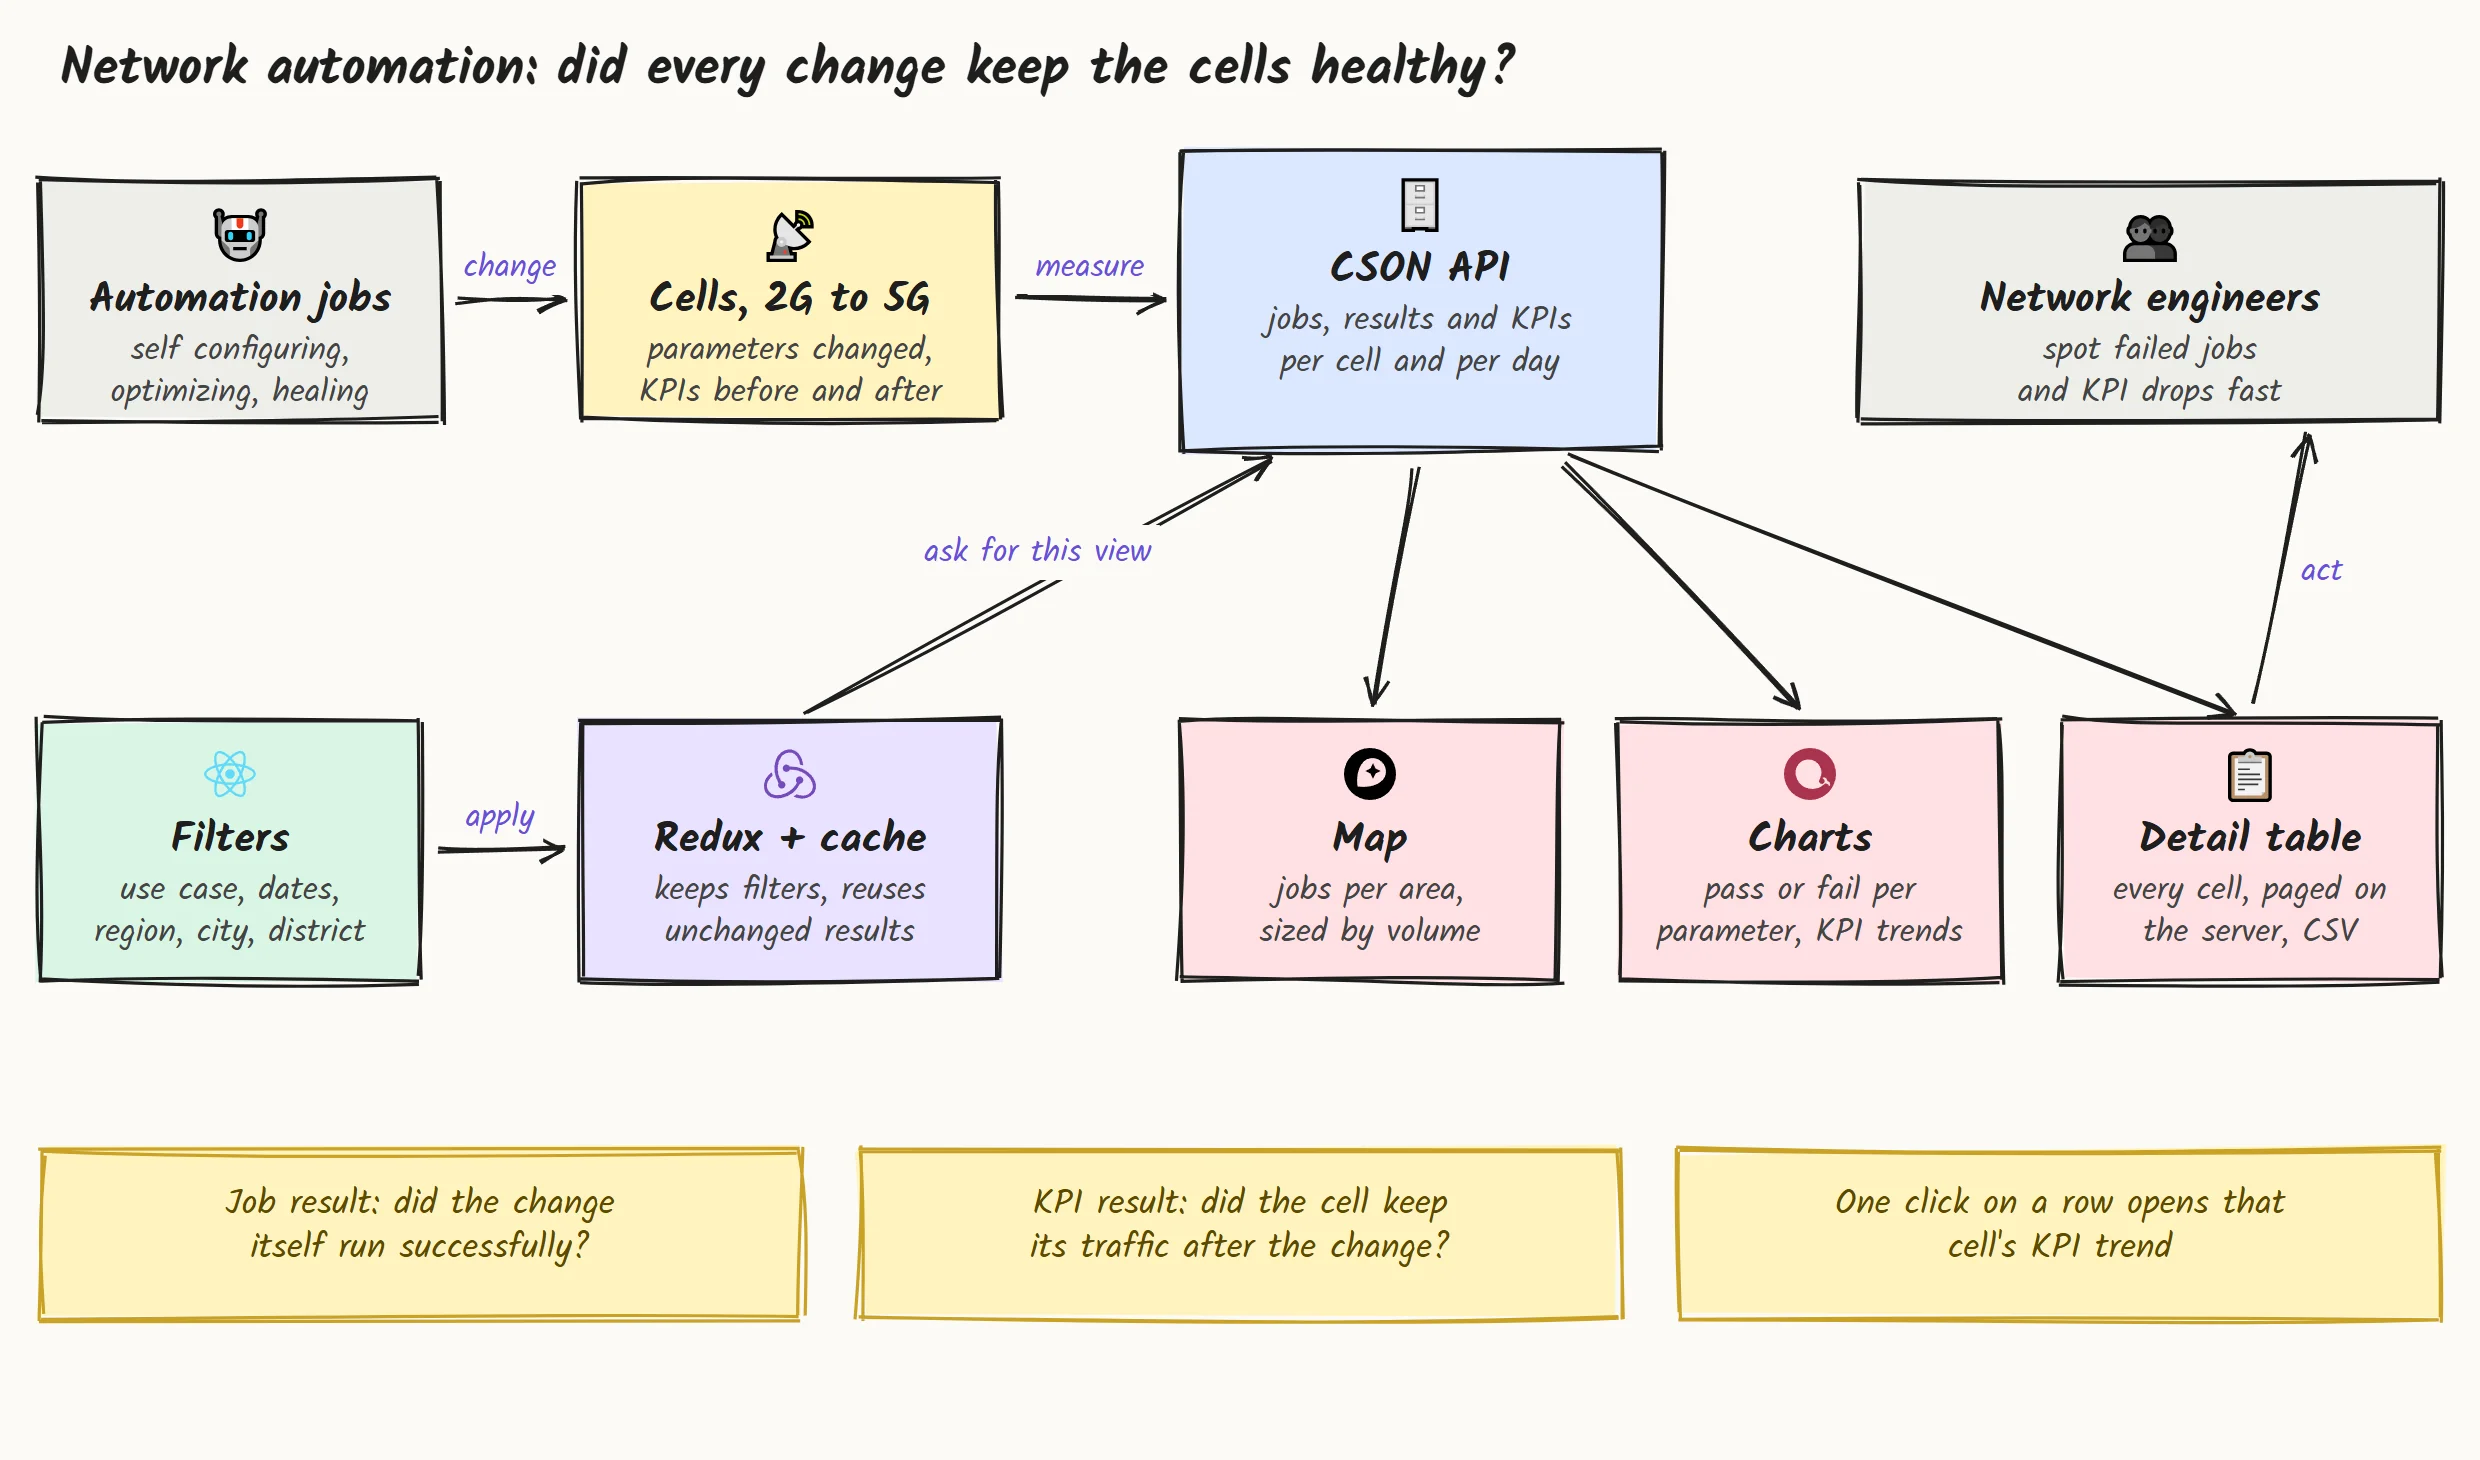
Automation jobs change parameters on cells across 2G, 4G and 5G, and each cell's KPIs are measured before and after. The CSON API serves the jobs, results and KPIs per cell and per day. The dashboard sits on top: a filter bar and a store that remembers your view and reuses results that haven't changed, then the map, charts and detail table that point the engineers at the changes worth a second look.
The hard parts, and how I solved them
-
Thousands of rows in one table. The detail list for a single week can run to thousands of changes. Paging, sorting and filtering all happen on the server, so the table stays instant, and the CSV download follows exactly the same filters you see on screen.
-
Changing the dashboard without a new release. Filter definitions, chart settings and the detail row layout load at runtime instead of being baked into the build. When the team tweaks a filter or a chart, the dashboard picks it up without waiting for a new deploy.
-
Thirty plus use cases, three generations. Use cases like energy saving, load balancing or sleeping cell recovery exist separately for 2G, 4G and 5G, sometimes with the same name. The filter groups them in a tree by network generation, so picking PCI on 5G never mixes in PCI on 4G.
-
Many KPI charts, read together. When you hover a date on one KPI chart, every other chart highlights the same date. A drop in throughput lines up with a drop in active users at a glance, no squinting at axes.
-
A check from the phone, too. On a phone the dashboard switches to its own layout: the filters slide up from the bottom, the sections stack, and the map shrinks to fit, so an engineer on site can still check last night's jobs.
How I write the code
-
One folder per section. Overview, map, summary charts, trends, KPI charts, tables and detail each have their own services, hooks and components.
-
40 tests on the numbers. The helpers that format values, scale the map dots, parse the data and pick colours are covered by unit tests, because a wrong number on this screen means a wrong call about the network.
-
Strict lint, zero warnings. TypeScript and React hook rules run with no warnings allowed, so small mistakes don't pile up.
-
Mock data first, company libraries underneath. Every endpoint has a mock in development, and the maps, charts, filters and API layer come from the team's internal packages.
Fast with a lot of data
-
Sections load on their own. Each part of the page loads separately and in parallel, so the job summary shows up without waiting for the big table.
-
No asking twice. Each section remembers its last result for the current filters, so opening the dashboard again shows it right away.
-
Comes back where you left it. Filters and the dark or light theme are remembered between visits.
Delivery
The build packages the whole dashboard into a single zip, ready to drop onto the operator's own portal under its own path, next to their other internal tools. No new infrastructure for their team to run.
What you get when you work with me
-
Visibility over automation. When software makes changes for you, you get a clear view of what it did and what it caused.
-
Big data, quick screens. Server side paging, caching and lazy loading, so thousands of rows still feel quick.
-
Fits into what you already run. Your libraries, your servers, your conventions.
What the operator's teams got
30+
Automation use cases, 2G to 5G, checked from one filter
40
Automated tests guarding the numbers on screen
0
Rebuilds needed to change a filter or a chart
Years of
Experience
Projects
Delivered
Features
In Production
Community
Members
Get in touch
Have a product to build, or a workflow that eats your team's time? Tell me about it.I'll build a small working piece of it first, free, so you can judge the result before you commit.