
A bad coverage dashboard: where the signal is weak, and what to fix first
A national mobile operator in Indonesia measures signal quality from customers' phones every week. Their regional teams needed to turn that into a to do list: which districts have weak coverage, are they getting better or worse, and should a spot be fixed by tuning a nearby site or does it need a new one. I built the dashboard that answers it, from the whole country down to a single antenna.
National mobile operator (Indonesia)
Full stack engineer, built the dashboard end to end
1 month
React, TypeScript, Mapbox, Turf, ECharts, Redux, Ant Design

The problem
Customers don't read coverage maps. They notice when a call drops in their own neighbourhood. The operator already had the data to find those places: signal strength and call counts from real phones, measured on small map tiles across the whole country, every single week.
The hard part was turning millions of measurements into decisions. Thousands of districts across every region, and a new week of data every week. Each regional team needed to know fast: where is it bad, is it a priority area, is it getting worse, and what kind of fix does it need.
What the dashboard answers
-
"How many of our areas are bad right now?" Three cards: Good, Bad Priority 1 for weak districts on the operator's priority list, and Bad Priority 2 for weak districts outside it. Each shows the count, the share, and the change from last week, so a manager sees in one glance if things moved.
-
"Where exactly?" The map colors every area by how much of it is good. Click a region and it zooms into its cities, click a city and you see its districts. Switch to grid view and the district splits into small squares, each one good or bad, with the nearby antennas drawn on top so you can see which site covers the weak spot.
-
"Is it getting better or worse?" A weekly trend of good versus bad, as numbers or percentages, from one month up to two years back. Next to it, two cards point at the biggest jump and the biggest drop between weeks, rotating through each status on their own.
-
"Give me the list for my region." A table per region, city or district with good and bad counts, shares and week over week change. Click a name to go one level down, and download the exact view as a CSV for the weekly report.
The architecture
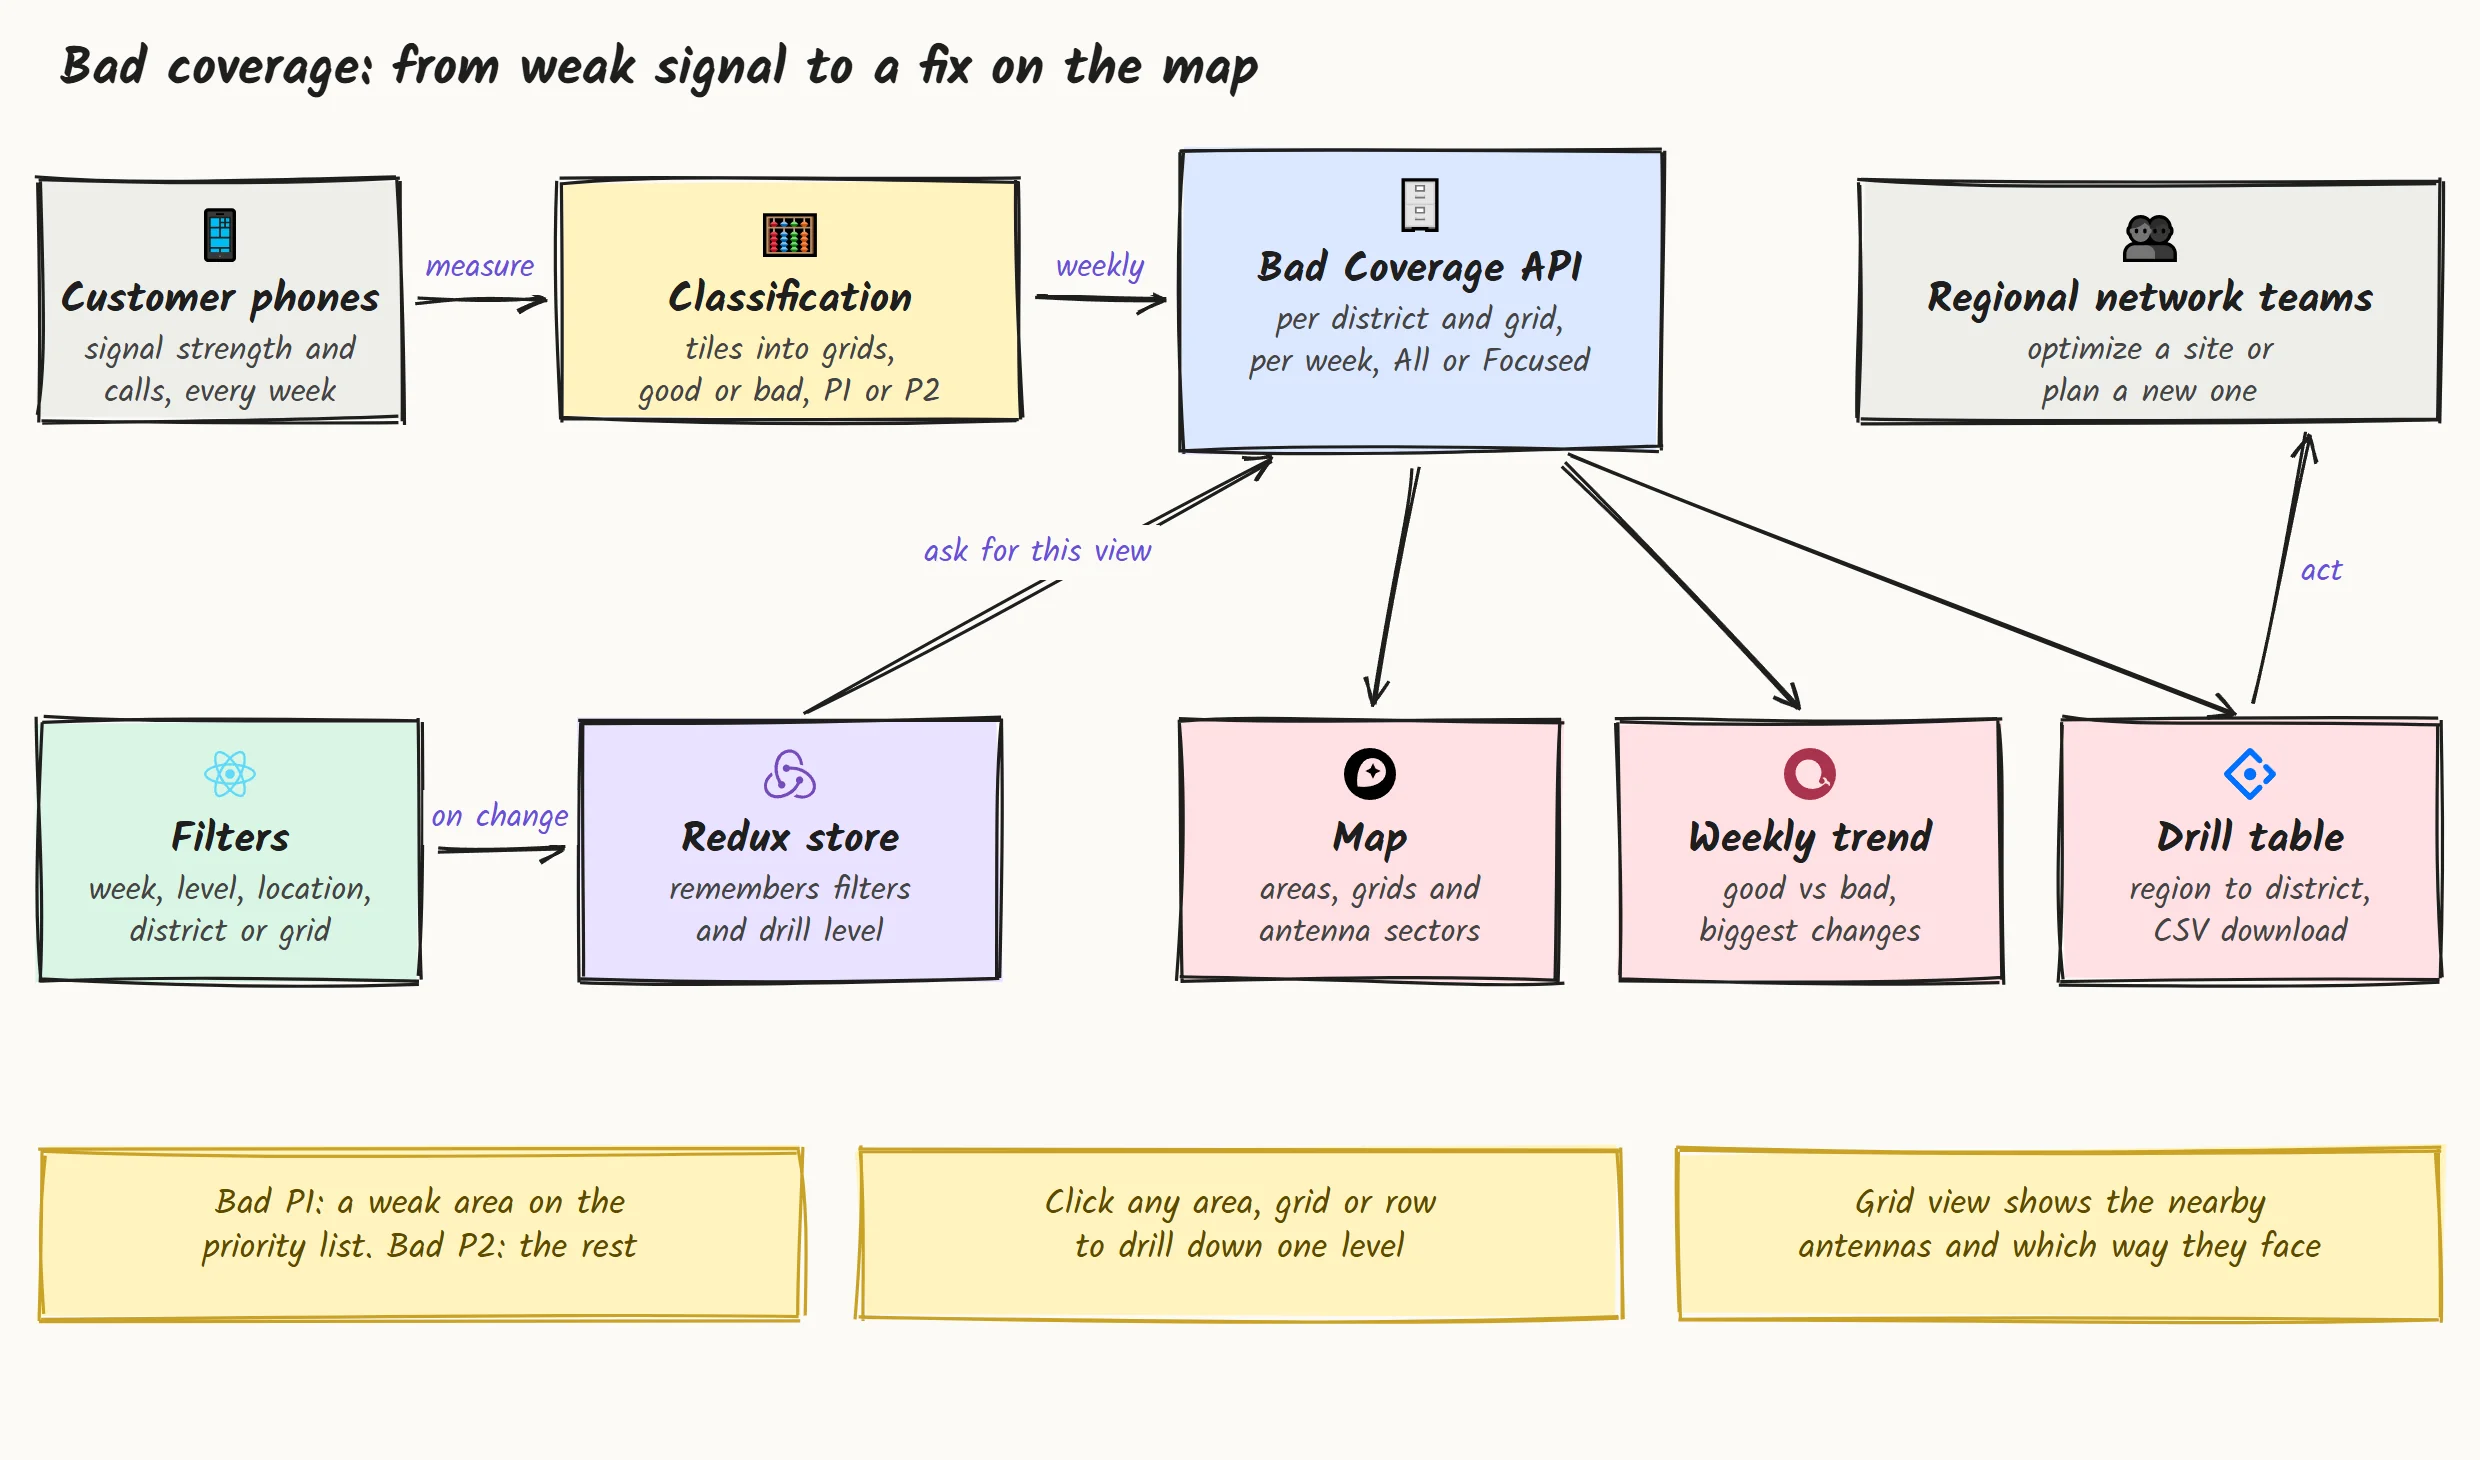
Phones measure signal strength and calls on small map tiles every week. The operator's data team groups those tiles into grids and classifies each one: good or bad, priority or not, and whether a bad spot needs tuning on a nearby site or new engineering work. The dashboard sits on top: a filter bar and a store that remembers your view, asking the API for exactly that view and feeding the map, the trend and the table.
The hard parts, and how I solved them
-
Four ways to drill down, one answer. You can go from nation to region to city to district by clicking the map, clicking the table, using the breadcrumb, or searching a location. All four move the same view, so the map, cards, trend and table never disagree. Pick a district from search and its city and region are filled in for you.
-
Showing which antenna covers a weak spot. Knowing a square is bad isn't enough. Click a bad grid and the map draws the nearby sites as wedges pointing the way each antenna faces, with its call count and CEI score. The engineer can see at once whether a site is aimed away from the problem.
-
Not every bad number can be trusted. A grid with very few measurements can look terrible by accident. The Focused view keeps only grids with enough samples, while All shows everything. One toggle, and a built in glossary explains each rule so nobody has to ask the data team what a status means.
-
Weeks, not dates. Telecom teams talk in week numbers. Every filter, trend and comparison works on year and week, including the jump from the last week of one year to the first of the next, so "this week versus last week" is always right.
-
A map that survives a theme switch. The dashboard has a dark and a light mode, and switching the map style normally wipes every custom layer. The dashboard puts the areas, grids and antennas back on their own, so the view you were on stays exactly where it was.

How I write the code
-
Mock data first. Every endpoint has a realistic mock response in development, so the screens could be built and reviewed while the API was still being finished.
-
TypeScript everywhere. Every filter, level and API response has a type, so a renamed field breaks the build instead of showing an empty map.
-
Tests on the tricky helpers. Week math, number formatting and the option lists have unit tests, because a wrong week label means the wrong comparison.
-
Built on the company's shared libraries. The API layer comes from the team's internal package, so this dashboard behaves like the rest of their tools.
Fast enough for a weekly review
-
Long tables that still scroll smoothly. The table only draws the rows on screen, so a list of hundreds of districts scrolls as smoothly as a list of ten.
-
Only what you're looking at. Each filter change asks for that one view, and the biggest change cards are worked out in the browser from data already loaded.
-
Comes back where you left it. Your filters and theme are remembered, so Monday's review opens on last week's view.
Delivery
The build packages the whole dashboard into a single zip, ready to drop onto the operator's own portal under its own path, next to their other internal tools. No new infrastructure for their team to run.
What you get when you work with me
-
Data turned into a to do list. I design around the decision your team makes every week, not around the raw tables.
-
Maps that do real work. Drill down, grids, site sectors, choropleths. Not just pins on a map.
-
Fits into what you already run. Your libraries, your servers, your conventions.
What the operator's teams got
6,900+
Districts on one map, each with its weekly status
1 click
From a weak spot to the antennas that cover it
0
New servers to run, it drops into their own portal
Years of
Experience
Projects
Delivered
Features
In Production
Community
Members
Get in touch
Have a product to build, or a workflow that eats your team's time? Tell me about it.I'll build a small working piece of it first, free, so you can judge the result before you commit.